
Plot Bayes' theorem
Use matplotlib and seaborn to plot Bayes’ theorem
P(A|X) = ( P(X|A)*P(A) ) / P(B)
Frist thing first, import everything we will need.
import numpy as np
import matplotlib as mpl
import matplotlib.pyplot as plt
import  seaborn as sns
from collections import Counter
%matplotlib inline
Suppose there are two type of fishes: fish-a and fish-b. We store length of each fish in the list of A, B, respectively. We have 100 Fish-a and 70 fish-b, on average, fish-a is smaller than fish-b.
mu1 = 6
delta1 = 2

mu2 = 10
delta2 = 1.5

fish_a = [int(i) for i in (delta1*np.random.randn(100) + mu1)]
fish_b = [int(i) for i in (delta2*np.random.randn(70) + mu2)]
fish =np.concatenate( (fish_a, fish_b))
Plot two type of fishes
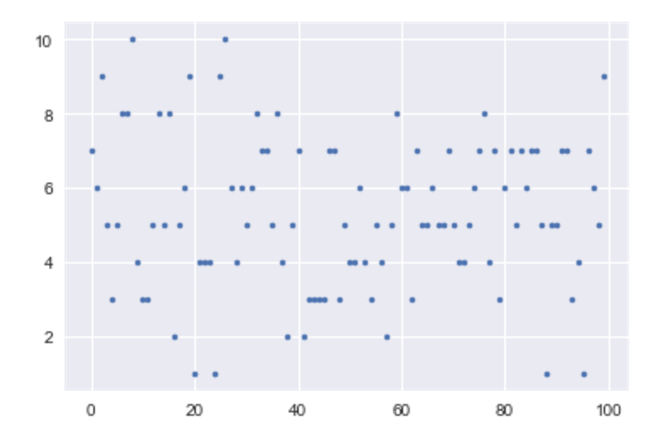
Scatter plot of fish_a, x: All fishes, y: Length of fishes
plt.plot(fish_a, ".")
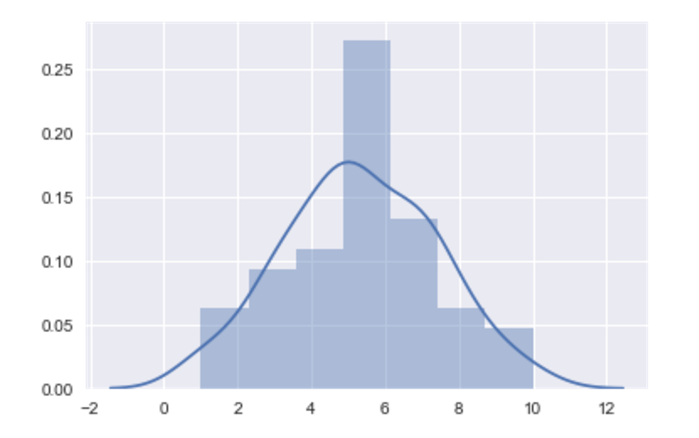
Histogram Graph of fish_a, x:Length of fishes, y: Probability of diffrent length
sns.distplot(fish_a)
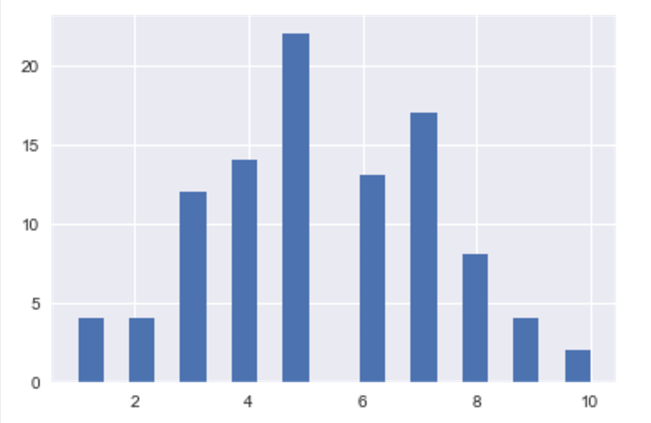
Histogramof fish_a, x:Length of fishes, y: Number of fishes in diffrent length
plt.hist(fish_a, bins = 20)
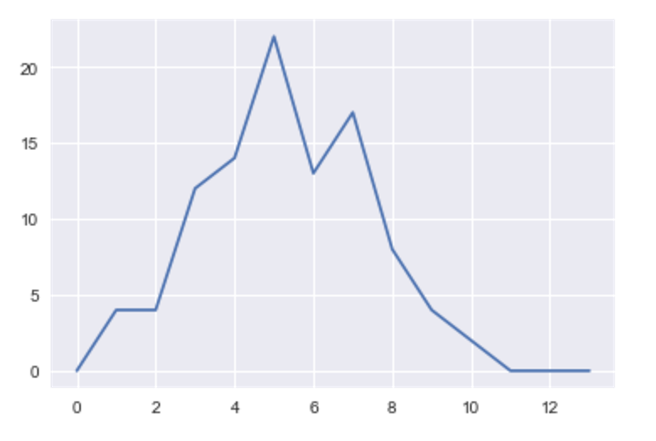
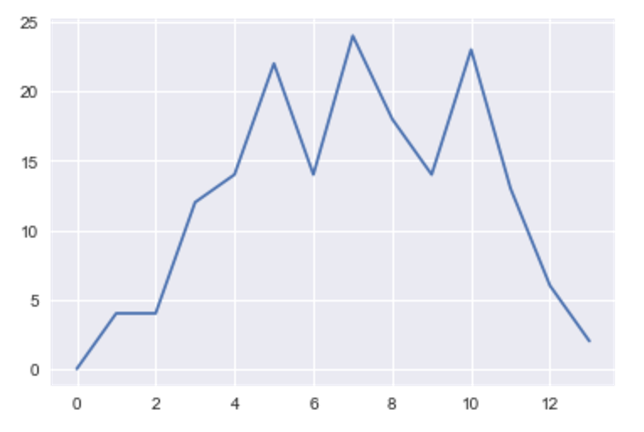
Graph of fish_a, x:Length of fishes, y: Number of fishes in diffrent length
a_l = range(14)
b_l = range(14)
count_a = Counter(fish_a)
counta_np = np.asarray([count_a.get(idx, 0) for idx in a_l]).astype(np.float32)
plt.plot(counta_np)
plt.show()
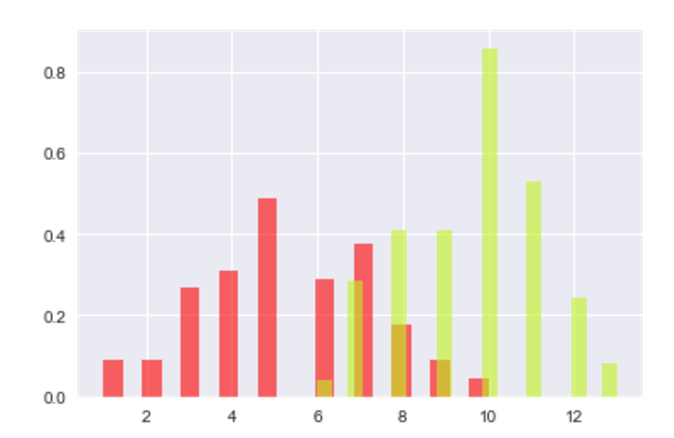
Histogramof two type of fishes, x:Length of fishes, y: Probability of fishes in diffrent length
plt.hist(fish_a, bins=20, normed=True, color="#FF0000", alpha=.6)
plt.hist(fish_b, bins=20, normed=True, color="#C1F320", alpha=.6)
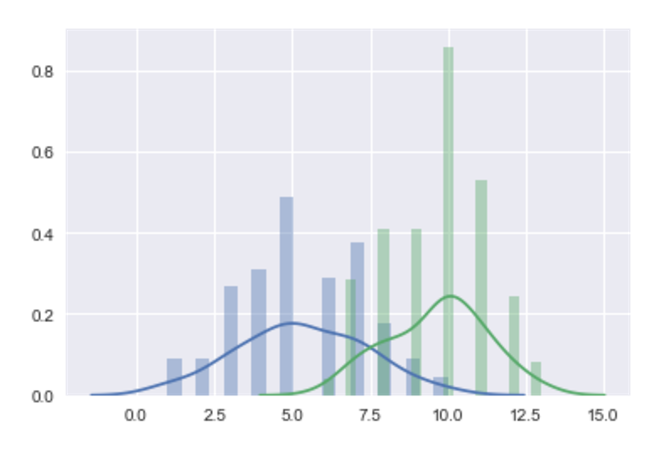
Histogram Graph of two type of fishes, x:Length of fishes, y: Probability of diffrent length
sns.distplot(fish_a, bins=20)
sns.distplot(fish_b, bins=20)
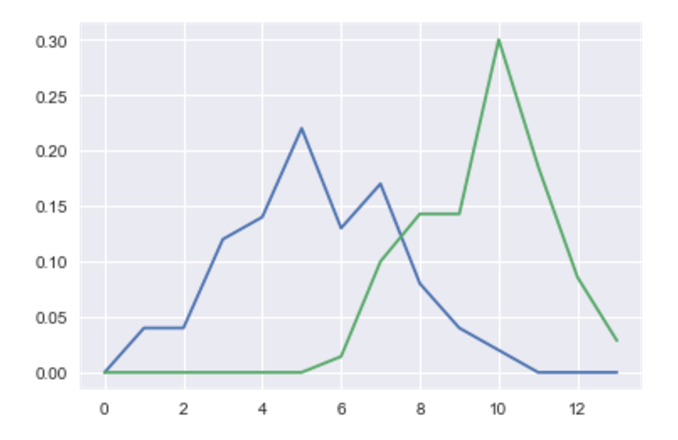
P(X|A), P(X|B), and plot
Graph of two type of fishes, x:Length of fishes, y: Probability of fishes in diffrent length
p_xa = (counta_np)/sum(counta_np)
p_xb = (countb_np)/sum(countb_np)

plt.plot(p_xa)
plt.plot(p_xb)
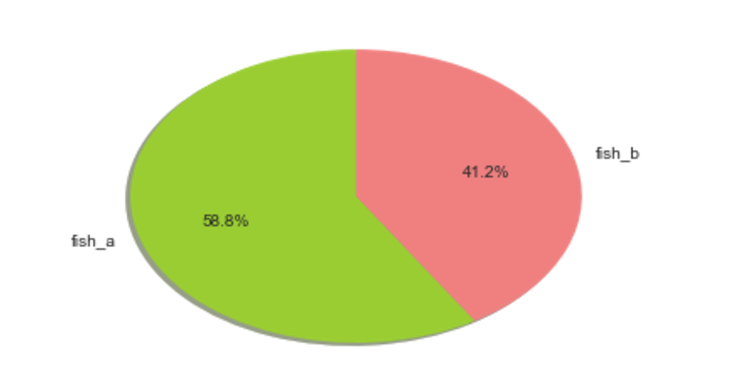
P(A), P(B)
Pie chart of two type of fishes.
labels = 'fish_a', 'fish_b'
sizes = [len(fish_a),len(fish_b)]
colors = ['yellowgreen', 'lightcoral',]

# Plot
plt.pie(sizes, labels=labels, colors=colors,
        autopct='%1.1f%%', shadow=True, startangle=90)
plt.show()
P(X)
Graph of all fishes, x:Length of fishes, y: Number of fishes in diffrent length
fish_l = range(14)
count_fish = Counter(fish)
countfish_np = np.asarray([count_fish.get(idx, 0) for idx in fish_l]).astype(np.float32)
plt.plot(countfish_np)
plt.show()
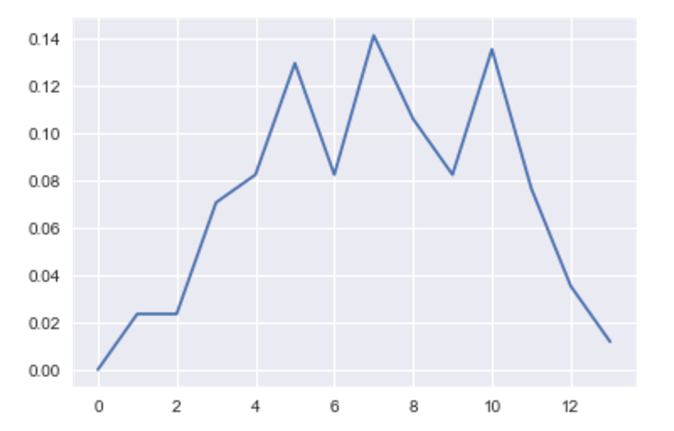
Graph of all fishes, x:Length of fishes, y: Probability of fishes in diffrent length
p_x = (countfish_np)/sum(countfish_np)
plt.plot(p_x)
P(A|X), P(B|X) and plot
| To get P(A | X) and P(B | X), we need P(A), P(B), P(X | A) and P(X | B). |
p_a =(len(fish_a))/len(fish)
p_b =(len(fish_b))/len(fish)
print p_xa,p_xb
output:

[ 0.    0.04  0.04  0.12  0.14  0.22  0.13  0.17  0.08  0.04  0.02  0.    0.
  0.  ]
[ 0.          0.          0.          0.          0.          0.
  0.01428571  0.1         0.14285715  0.14285715  0.30000001  0.18571429
  0.08571429  0.02857143]
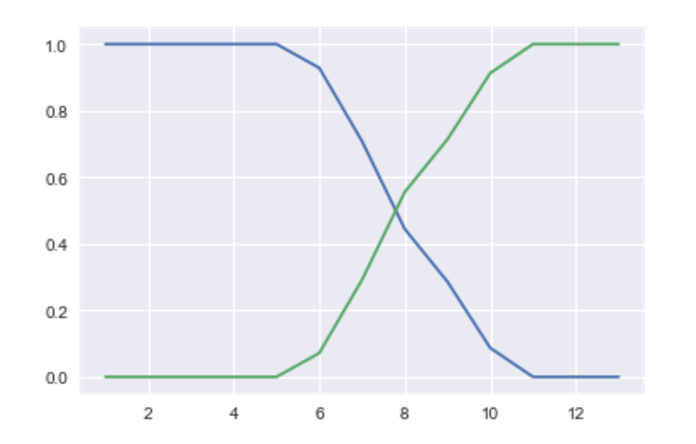
Graph of all fishes, x:Length of fishes, y: Probability of type of fishes in diffrent length
plt.plot(p_xa *p_a/p_x)
plt.plot(p_xb *p_b/p_x)
June 29, 2017